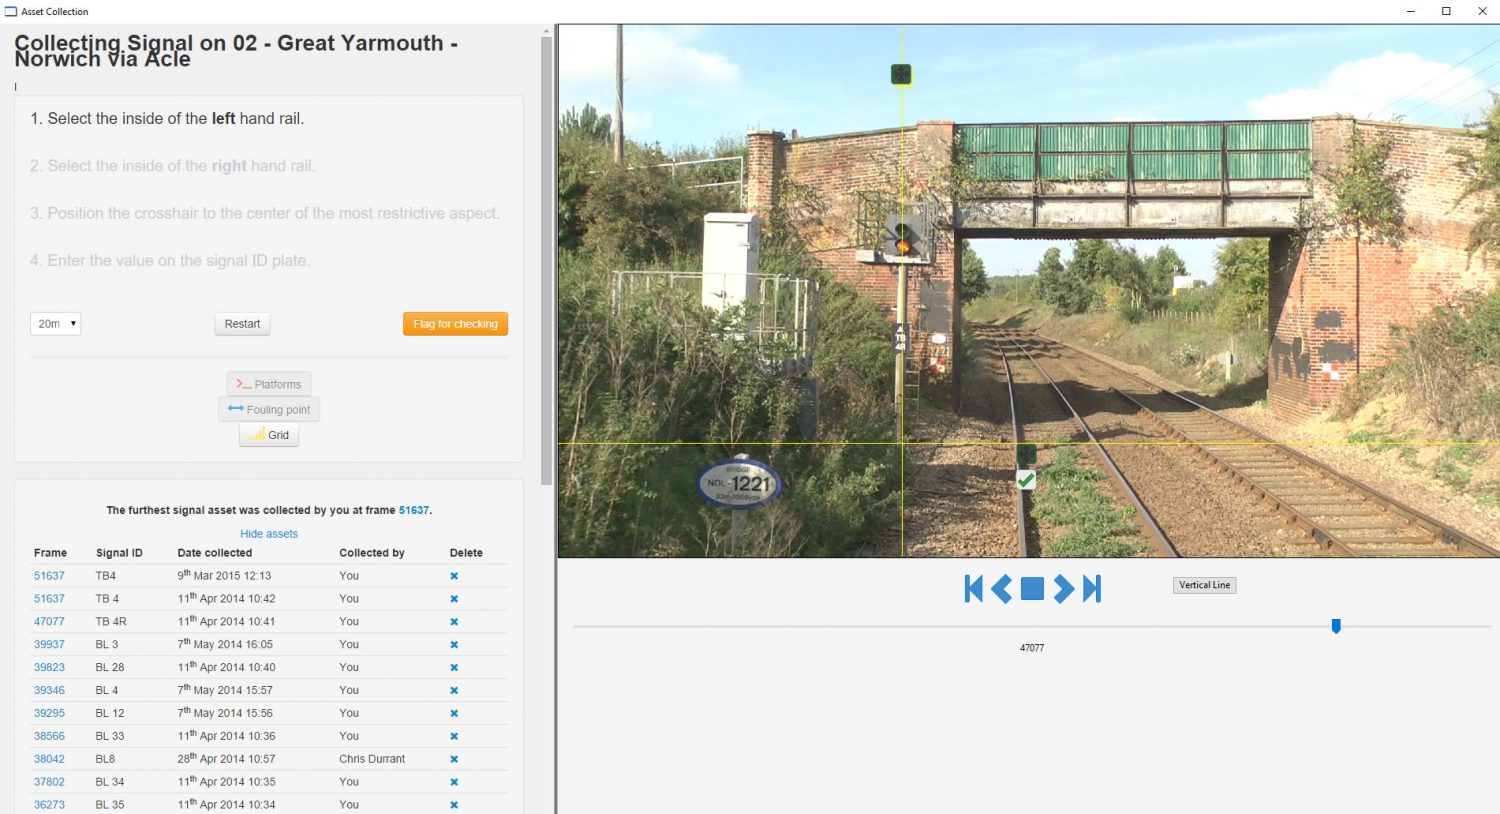
A powerful tool and process for inspecting the railway as part of the design process.
Fantastic 4K HD Video correlated to mileage, meterage and project grid.
Survey locations of existing assets – measure heights, offsets & clearances – log and record data with editable screen shots.
A good tool to prepare for signal sighting assessments.
KEY BENEFITS
- Removes the need to send operatives on track
- Repeatable trackside measurements from within the safety of the office
- Provides the base data for Signal Sighting and Driver Briefing
- Inbuilt calculations for signalling design
THE ASSET MAPPING PROCESS:
FILMING
We can obtain high definition footage from a wide variety of sources, however, Gioconda prefers to use its own skilled camera operators to ensure the very best quality footage. Our bespoke camera rig obtains a viewpoint close to the driver’s eye line, without impeding their actual view during filming. A calibrated set-up ensures that measurements and overlays are accurate and repeatable.
Up to 4K HDV gives fantastic detail allowing the user to identify ID plates and finite detail – see more info on 4K here
CORRELATION
Once route filming is completed, GPS data and known locations are associated to specific frames – this is key to accurate chainage measurements. However, a common problem is the inaccuracy and differences between chainages used by the different design disciplines. Our process goes some way to highlighting these errors, and our internal set-up tools are unique in that we can either work to true distance travelled (PWAY meterage) or a derived chainage (Schemeplan meterage). In all cases the measurements are in metre units.
ASSET MAPPING
Gioconda provide a service to asset map the railway. Locating over 70 asset types from our clients requirements and providing this data within our G-RAST software along with outputs in –
- eXcel & CSV
- CAD – DGN & DWG
- Picture Database
- Google View
Once an asset map has been collected the user can further survey existing & proposed locations and associated screen captures (with overlaid sketches & notes) can be added to these locations. On site photographs, or other documents can also be linked with these locations using the object management functions.
The ruler function enables visual offset & height measurements to be taken as part of the route assessment task. Surveying the position of signals, LOCs, & trackside assets is very simple and can help to reduce the content required by detailed on site survey.
Typically the design team will use the G-RAST to assess the position of proposed signalling prior to issuing draft scheme plans & sighting forms. Through this process it is possible to reduce the iterations of scheme plan issue and move to an SSC earlier. The G-RAST is an ideal tool for Grip stages 2 – 4 scheme development.
OBJECT MANAGEMENT
When preparing for a desktop signal sighting session we recommend the use of the Object Manager module. Through this section the user can associate relevant files to pre-set locations in the HD video. Images, documents, drawings, SSFs etc can all be stored on the database allowing easy access to these reference items at meetings & SSCs.

